
Table of Contents
PlusHeadlines are pleased to present you the first batch of data on Internet use worldwide in 2020. This is a complete collection of up-to-date Internet stats and facts from most authoritative sources online.
Make sure to scroll all the way down for more info.
Overview of global internet use
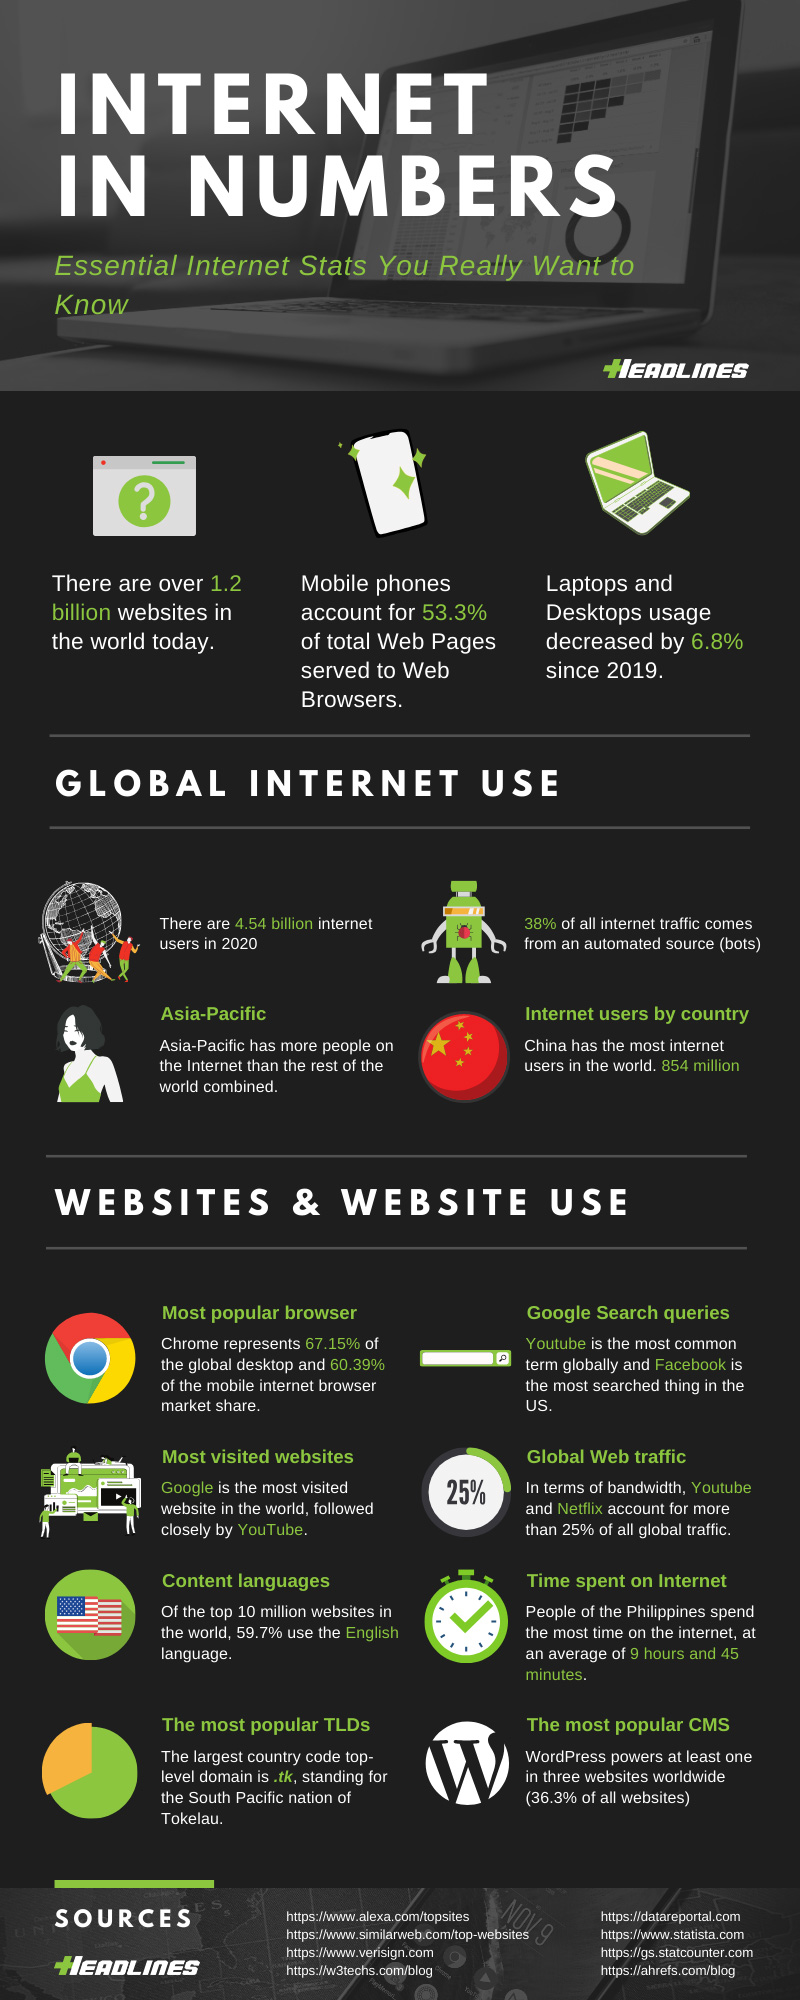
Surprisingly, slightly more than half of all internet traffic comes from actual humans. Roughly 38% is from an automated source (bots) and one in five website requests is generated by malicious bots alone. Malicious bots are responsible for offensive attacks on websites, mobile apps, and APIs.
Now, let’s take a look at the scale of real internet users.
How many people use the internet?
As of January 2020, there are 4.54 billion people who use the Internet worldwide. This represents 59% of the world’s population. The percentage of the total population of a given country or territory that uses the internet is also called the Internet Penetration Rate.
There are 4.18 billion users who access the internet via mobile phones. They amounted to 92% of total internet users.
At the beginning of 2020, mobile phones accounted for 53.3% of total Web Pages served to Web Browsers. That’s an increase of 8.6% from last year. Consequently, Laptops and Desktops usage decreased by 6.8%, amounting in total to 44% of web traffic share.
Internet user numbers over time
| Year | Number of global internet users in billions |
|---|---|
| 2015 | 2.831 |
| 2016 | 3.153 (+11%) |
| 2017 | 3.570 (+13%) |
| 2018 | 3.753 (+5.1%) |
| 2019 | 4.241 (+13%) |
| 2020 | 4.538 (+7%) |
Internet users around the world by region
Asia-Pacific

Asia-Pacific has the largest number of internet users, standing at 2.42 billion. With a total population of 4.30 billion, the region’s internet penetration rate stands at 56%. This is a 9.2% increase compared with 2019.
Americas
In the Americas, there are 776.1 million people using the internet today. This makes up 79% of the entire region population and +2.3% annual change in internet users.
Europe
Europe is a close third place with 711.3 million internet users (1.1% annual increase) and an internet penetration rate of 84 percent.
Africa
With a total population of 1.32 billion, Africa has an internet penetration of 34%. This means the number of people using the internet is 453.2 million, so there was a remarkable annual increase of about 10%.
The Middle East
And lastly, there are 182.1 million internet users in the Middle East. The region’s internet penetration rate is about 70% with the biggest increase in internet users of 14%.
Countries with the most internet users
Speaking about individual countries, China was ranked first among the countries with the most internet users. As of January 2020, China had 854 million internet users, the second comes India with 687.6 million users, and still, that’s more than double the amount of third-ranked United States with just over 293 million internet users.
It’s not so surprising that China, India, and the U.S have the most – they are the 3 most populated countries in the world, after all. And if you go down the list, the tendency remains the same, though not in order.
Internet Penetration Rankings
Countries with the highest levels of internet penetration
Iceland, Kuwait, Qatar, the UAE, and Bahrain hold the highest internet penetration rate of 99 percent each.
- Iceland, Kuwait, Qatar, U.A.E, Bahrain 99%
- Bermuda 98%
- Denmark, Norway 98%
- Aruba 97%
- Luxembourg 97%
Countries with the lowest levels of internet penetration
As of January 2020, North Korea was ranked first with an internet penetration of virtually zero percent. South Sudan and Eritrea follow with 8.0% and 8.3% respectively.
- North Korea 0.0%
- South Sudan 8.0%
- Eritrea 8.3%
- Burundi 9.9%
- Somalia 10%
- Niger 12%
- Papua New Guinea 12%
- Liberia 12%
- Guinea-Bissau 13%
- Central African Rep. 14%
Time per day spent using the internet
The average amount of time per day spent using the internet by each internet user is 6 hours and 43 minutes.

The study found that the people of the Philippines spend the most time on the internet, at an average of 9 hours and 45 minutes. The Philippines ranked #1 country in the world for spending the most time online via mobile phone as well. Filipinos spend approximately 5h 11min each day using the internet on mobile.
In the United States, people spend an average of 6 hours and 42 minutes – one minute less than the worldwide average.
The least average time spent using the internet each day on any device and on mobile is by people of Japan – at only 4 hours and 22 minutes, and 1 hour and 32 minutes respectively.
Countries that spend the most time online
| Average amount of time using the internet each day on any device | |
|---|---|
| 1. Philippines | 9h 45min |
| 2. South Africa | 9h 22min |
| 3. Brazil | 9h 17min |
| 4. Columbia | 9h 10min |
| 5. Thailand | 9h 01min |
Countries that spend the least time online
| Average amount of time using the internet each day on any device | |
|---|---|
| 1. Japan | 4h 22min |
| 2. Netherlands | 4h 37min |
| 3. Germany | 4h 52min |
| 4. Denmark | 5h 07min |
| 5. France | 5h 08min |
Countries that spend the most time online on mobile phone
| Average amount of time using the internet each day on mobile | |
|---|---|
| 1. Philippines | 5h 11min |
| 2. Thailand | 4h 57min |
| 3. Nigeria | 4h 50min |
| 4. Columbia | 4h 49min |
| 5. Indonesia | 4h 46min |
Countries that spend the least time online on mobile phone
| Average amount of time using the internet each day on mobile | |
|---|---|
| 1. Japan | 1h 32min |
| 2. Germany | 1h 52min |
| 3. Belgium | 1h 55min |
| 4. Denmark | 1h 58min |
| 5. France | 1h 59min |
Global internet traffic share
In 2020, just like years before, a majority of internet traffic in terms of bandwidth is video. According to Sandvine, a vendor of bandwidth-management systems, video accounts for roughly 60% of all internet traffic.

While this figure is similar to last year’s findings, the COVID-19 worldwide pandemic has drastically affected network usage around the world, with traffic growing by almost 40% overall.
It is important to note that most of the major video streaming services (including YouTube and Netflix) “voluntarily” reduced their default resolution to standard definition during the global event, so this number could have been much higher if HD and 4K streams had been more frequent.
Social networking traffic alone was second overall with 10.73%, and with all Social Sharing categories combined, it accounts for 17.5% of total traffic volume.
Web traffic was the third biggest category, with an 8% share of all global traffic.
What uses the most bandwidth on the Internet?
Pretty much all traffic types grew during the COVID-19 worldwide pandemic in 2020, yet some applications grew faster than others.
As a result, web-based media streaming apps have lost the top spot to Youtube.
With over 15% of all global traffic during the first few months of the global shutdown, Youtube ranked as the biggest application in terms of bandwidth consumption on internet networks.
Netflix was second overall with 11.4%, respectively.
Last year’s report claimed that amid the growing popularity of piracy services, more consumers worldwide turned to HTTP Media Stream long-tail providers. Back then, HTTP media streaming represented 13.76% of total traffic share and now it accounts for only 3.6%.
This indicates the decline in popularity of secondary streaming services and the focus on binge-watching on the major OTT services. Of course, with almost non-existent sporting events amid Covid-19, most of these services have had to work hard to keep at least some attention up.
Share of global web traffic by browser
Google’s Chrome is by far the most popular browser in the world, representing 67.15% of the global desktop and 60.39% of the mobile internet browser market share.
It’s followed, by a large margin difference, by Safari at 9.7% and 26.56% respectively. In third place is Firefox at 9.18% of the desktop and only 0.4% of the mobile internet browser market share.
Most popular web browsers for desktop

- Chrome 67.15%
- Safari 9.7%
- Firefox 9.18%
- Edge Legacy 4.86%
- IE 3.26%
Most popular web browsers for mobile
- Chrome 60.39%
- Safari 26.56%
- Samsung Internet 6.33%
- UC Browser 3.49%
- Opera 1.29%
Internet connection speed rankings
The average speed of fixed internet connections is 73.58 Mbps. This figure corresponds to +35% of the year-on-year change in the average speed of fixed internet connections.
The average speed of mobile internet connections is 32.01 Mbps. That’s a 28% increase compared to the previous year.
Countries with the fastest fixed internet connection speeds
- Singapore 200.12 Mbps
- Hong Kong 164.88 Mbps
- Romania 144.92 Mbps
- South Korea 144.41 Mbps
- Switzerland 144.31 Mbps
- Taiwan 137.90 Mbps
- France 131.25 Mbps
- Sweden 131.13 Mbps
- U.S.A 130.79 Mbps
- Hungary 128.07 Mbps
Countries with the slowest fixed internet connection speeds
- Turkmenistan 1.71 Mbps
- Vanuatu 3.25 Mbps
- Venezuela 3.42 Mbps
- Algeria 3.92 Mbps
- Yemen 4.39 Mbps
- Mauritania 4.91 Mbps
- Cuba 5.37 Mbps
- Dem. Rep. Of The Congo 6.25 Mbps
- Sudan 6.81 Mbps
- Afghanistan 6.92 Mbps
Countries with the fastest mobile internet connection speeds
- South Korea 103.13 Mbps
- U.A.E 86.77 Mbps
- Qatar 79.21 Mbps
- Canada 70.74 Mbps
- China 67.71 Mbps
- Australia 67.66 Mbps
- Netherlands 67.08 Mbps
- Norway 66.91 Mbps
- Bulgaria 63.98 Mbps
- Croatia 61.54 Mbps
Countries with the slowest mobile internet connection speeds
- Palestine 6.17 Mbps
- Afghanistan 6.82 Mbps
- Algeria 7.88 Mbps
- Venezuela 8.35 Mbps
- Sudan 8.60 Mbps
- Rwanda 9.07 Mbps
- Uzbekistan 9.51 Mbps
- Iraq 9.81 Mbps
- Tajikistan 10.30 Mbps
- El Salvador 10.32 Mbps
Website and Website Traffic Statistics
There are over 1.2 billion websites in the world today.
While it’s true that the exact number of websites keeps changing every second, the majority of them are being used just as parked domains or in a similar manner. Roughly 85% of all websites are simply inactive.

In the April 2020 survey Netcraft received responses from 1,246,121,153 sites across 260,089,947 unique domains. And it turns out that there are only 191,172,307 active sites on the Web.
Google Search index size and Top Worldwide Queries
According to worldwidewebsize.com, the Indexed Web contains at least 5.65 billion pages (Sunday, 10 May 2020). Despite the fact that the site developed a statistical method for tracking the number of pages indexed by major search engines, Google themselves claim that the Google Search index contains hundreds of billions of webpages.
Not to mention a number of actual webpages Google are aware of across the web. 130 trillion individual pages were the last official figure they’ve shared in November 2016.
How many searches on Google per second, per day, and year?
Even though the search estimates vary throughout different reports, it is evident that Google handles quite a lot of searches at any given moment.
According to Internet Live Stats as of May 2020, The Google Search engine now processes around 82,683 search queries every second on average, which translates to over 7.1 billion searches per day and 2.6 trillion searches per year worldwide.
Top 10 Google search queries around the World
Obviously, people search a lot on Google, but what is the most searched query on Google? As of April 2020, Youtube is the most common term globally and Facebook is the most searched thing in the US.
It is no coincidence that the list of most searched queries is dominated by branded searches. Instead of using the bookmarks bar, many people tend to google these brands each time they want to access a particular website.
| World | US | |
|---|---|---|
| 1. | youtube | |
| 2. | youtube | |
| 3. | gmail | amazon |
| 4. | gmail | |
| 5. | hotmail | |
| 6. | amazon | weather |
| 7. | whatsapp web | ebay |
| 8. | translate | yahoo |
| 9. | traductor | walmart |
| 10. | google translate | yahoo mail |
Top 10 most visited websites in the world 2020
Google is the most visited website in the world, followed closely by YouTube. Don’t forget – YouTube is owned by Google. Less visited websites vary according to the methodology used.
Here is a list of the most popular websites in the US and around the world as stated in “The top 500 sites on the web” report by Alexa Internet, as of April 16, 2020, and SimilarWeb, as of April 1, 2020.
| Similarweb Rank* | Top Websites (Worldwide) | Category | Top Websites (US) | Category |
|---|---|---|---|---|
| 1. | google.com | Search Engines | google.com | Search Engines |
| 2. | youtube.com | TV Movies and Streaming | youtube.com | TV Movies and Streaming |
| 3. | facebook.com | Social Networks and Online Communities | facebook.com | Social Networks and Online Communities |
| 4. | twitter.com | Social Networks and Online Communities | amazon.com | Marketplace |
| 5. | baidu.com | Search Engines | yahoo.com | News and Media |
| 6. | instagram.com | Social Networks and Online Communities | twitter.com | Social Networks and Online Communities |
| 7. | wikipedia.org | Dictionaries and Encyclopedias | instagram.com | Social Networks and Online Communities |
| 8. | yahoo.com | News and Media | wikipedia.org | Dictionaries and Encyclopedias |
| 9. | yandex.ru | Search Engines | reddit.com | Social Networks and Online Communities |
| 10. | vk.com | Social Networks and Online Communities | ebay.com | Marketplace |
| Alexa Internet Rank | Top Websites (Worldwide) | Category | Top Websites (US) | Category |
|---|---|---|---|---|
| 1. | google.com | Search Engines | google.com | Search Engines |
| 2. | youtube.com | TV Movies and Streaming | youtube.com | TV Movies and Streaming |
| 3. | tmall.com | Marketplace | amazon.com | Marketplace |
| 4. | facebook.com | Social Networks and Online Communities | facebook.com | Social Networks and Online Communities |
| 5. | baidu.com | Search Engines | yahoo.com | News and Media |
| 6. | qq.com | News and Media | zoom.us | Computers Electronics And Technology in the world |
| 7. | sohu.com | News and Media | reddit.com | Social Networks and Online Communities |
| 8. | login.tmall.com | Marketplace | wikipedia.org | Dictionaries and Encyclopedias |
| 9. | taobao.com | Marketplace | netflix.com | TV Movies and Streaming |
| 10. | 360.cn | Computer Security in the world | ebay.com | Marketplace |
Interestingly enough, while Top websites in the US ranked by Alexa don’t differ much from Similarweb, global standings shed light on the entirely different segment – Chinese internet usage. 7 out of the 10 most visited sites worldwide are actually Chinese.
However, China has one of the most tightly controlled internet environments in the world.
Over the past decade, China has blocked thousands of foreign websites, including such internet giants as Google, Youtube, Facebook, and Twitter. New Chinese websites and web services came into view as their alternatives and gained popularity among citizens and policymakers.
While heavily censored by the government, Chinese web services remain the most convenient option for consumers to browse and search the internet in mainland China. It’s little wonder that Chinese websites get a massive amount of traffic just because of these circumstances and appear among the Top 10 Websites in the world due to its population size.
Domain name statistics, facts and trends
Domain name system people use today was first implemented by IANA (Internet Assigned Numbers Authority) in January 1985. Since then, TLD, or top-level domain extension, simply refers to the letters at the end of the domain. In fact, domains are organized hierarchically from right to left – thus the name top-level domain.
Generic top-level domains (gTLDs) are one of the categories of TLDs. They are called generic for historic reasons. Prior to the launch of the new gTLD program in October 2013, there were 22 gTLDs.
The new gTLD program was developed to foster diversity and competition in the Internet namespace by enabling the largest expansion of the domain name system yet.
How many TLD’s are there?
As of May 2020, there are exactly 1,513 TLD’s out there to choose from for internet addresses. New gTLDs make up the majority of this number, with 1,185 different extensions present.
2020 started with 362.3 million domain names across all top-level domains. In contrast to the variety of domain names available, the total new gTLDs base accounted only for ~30 million domain name registrations.
What are the most popular TLDs?
In 2020, the largest TLDs by number of recorded domain names are .com, .tk, .cn, .de, .net, .uk, .org, .nl, .ru, and .icu.
The most popular top-level domain extension is .com, accounting for approximately 40.1% of all domain names, followed by .tk at almost 7%, with .cn coming in third at 6.3% and .de in fourth at 4.5%.

Country-code TLD (ccTLD) domain name registrations make up nearly half (43.5%) of all current registered domain names. At the beginning of 2020, there were 157.6 million ccTLDs. The top 10 ccTLDs were .tk, .cn, .de, .uk, .nl, .ru, .br, .eu, .fr and .it.
The largest country code top-level domain remains .tk, standing for the South Pacific nation of Tokelau. This tiny island has registered more ccTLDs than any other country, including Germany or even China. The reason for the massive number of registrations is due to the country’s distinctive operating model, which allows Internet users from abroad to register domains for free for 12 months.
As of May 2020, among new gTLDs, .icu is the leading extension with 6.6 million registered domains. This is followed by .top and .xyz at 3.8 and 3.1 million respectively.
Web Development Statistics
Most-popular languages on the Internet
There is debate over the most-used languages on the Internet. It seems that in most reports people are confusing languages used by populations with languages used for websites.
In theory, a language’s presence online should be mostly determined by the number of internet users for that specific language, but in practice, it’s not even close.
According to W3Techs, of the top 10 million websites in the world, 59.7% use the English language. Following this are Russian, Spanish, Turkish, and Persian (in that order).
| Language | % of the top 10 million websites | % of the World’s Internet Users |
|---|---|---|
| English | 59.7% | 25.9% |
| Russian | 8.6% | 2.5% |
| Spanish | 4.0% | 7.9% |
| Turkish | 3.0% | 1.4% |
| Persian | 2.8% | 1.6% |
| German | 2.7% | 2.0% |
| French | 2.7% | 3.3% |
| Japanese | 2.3% | 2.6% |
| Portuguese | 2.0% | 3.7% |
| Chinese | 1.5% | 19.4% |
| Total | 89.3% | 70.3% |
Top 10 million websites represent 5.2% of total active sites on the web. Therefore, the idea that a similar trend may exist for the remaining sites is rather optimistic and does not seem to hold entirely true, especially, considering China’s case.
If almost 20% of web users speak Chinese, why is only 1.5% of the content on the internet in Chinese?
For the sake of argument, let’s assume that a country code TLD is specifically targeted to a certain country/region AND language. In this sense, .cn, standing for China and the Chinese language, accounts for 6.3% of total unique domains in the world.
This slightly adjusts the said statistics: the percentage of total Chinese content online could be actually closer to 6.3% instead of 1.5%.
And this is just one example. The same could be applied to other languages as well.
Most popular web hosting providers
As of May 2020, Amazon and GoDaddy Group are the most popular web hosting providers in the world. They host approximately 5.8% of websites each, followed by Endurance Group at 5.4%, and OVH at 3.3%.
Most popular content management systems

WordPress is the most popular content management system (CMS) with a market share of 63.3%. WordPress powers at least one in three websites worldwide (36.3% of all websites).
Most notable big name brands that are using WordPress on their websites include Sony Music, BBC America, Beyonce, Vogue, and many more.
Additionally, based on the top 10 million websites on the internet, WordPress is the fastest growing CMS in 2020.
Joomla is the second most popular CMS with a market share of 4.1%, followed by Shopify at 4% and Drupal at 2.7%.
Most popular server-side programming languages
PHP is by far the most used scripting language for server-side development. 78.4% or almost 8 out of every 10 websites on the world wide web are using PHP in some way.
While ASP.Net is not a programming language itself, it’s responsible for the backend development of 10.7% of websites on the internet.
Java and Ruby share third place with 3.5%.
Summary
The internet is a vast network of services and potentially invaluable knowledge. By its very nature, Internet is neutral. However, the way it influences us depends on how we engage with it individually.
The web provides something for everyone: the means of socialization, education, and entertainment.
Usually, people don’t find statistics as a common ground for debate. There are those who say that we need them to make sense of society as a whole, and then there are the others, who say that statistics don’t really reflect what’s happening in people’s day-to-day lives.
It’s easy to understand why people are frustrated with global averages when they don’t match up with their personal experiences. The point of this isn’t necessarily that every single data set has to relate specifically to you.
The main point of Internet statistics is to better measure the population in order to better serve it. And anyone failing to keep up could quickly lose touch with the rest of the world.
Give us your feedback in the comment section below and please share if you find it informative.
References
- https://datareportal.com/reports/digital-2020-global-digital-overview
- https://blog.radware.com/security/2020/04/trends-in-the-automated-attack-landscape-the-impact-on-businesses/
- https://www.statista.com/statistics/617136/digital-population-worldwide/
- https://www.statista.com/statistics/725778/countries-with-the-lowest-internet-penetration-rate/
- https://www.statista.com/statistics/227082/countries-with-the-highest-internet-penetration-rate/
- https://gs.statcounter.com/browser-market-share/
- https://searchengineland.com/googles-search-indexes-hits-130-trillion-pages-documents-263378
- https://www.internetlivestats.com/google-search-statistics/
- https://ahrefs.com/blog/top-google-searches/
- https://www.alexa.com/topsites
- https://www.similarweb.com/top-websites
- https://www.icann.org/resources/pages/tlds-2012-02-25-en
- https://www.verisign.com/en_US/domain-names/dnib/index.xhtml
- https://www.theguardian.com/news/datablog/2016/mar/09/worlds-highest-number-of-domains-the-south-pacific-nation-of-tokelau
- https://ntldstats.com/tld
- https://w3techs.com/blog